Team performance report
Check the report of a whole department or any operator individually.
The “Team performance report” feature is made to optimize the work of your support service and help you understand if you need to change working hours, hire more operators or if you need to change anything else in how your support team operates. “Team performance report” is available in the “Reports” section. Let's define basic concepts and see how it works.
Basic concepts
“Started conversations” are conversations initiated by users via chat or by replying to triggered messages.
Conversation is considered as “Closed” when an operator solves the question and closes the conversation by clicking "Close conversation" or using a keyboard shortcut (CTRL+O closes the conversation, CTRL+Q removes the assignment from the conversation and closes it). When a conversation gets closed, it sets off a timeout before a question in the conversation is defined as “Solved”. If the user you had the conversation with contacts you before the timeout expires, this conversation gets re-opened. If this user contacts you after the timeout passes, a new conversation question will be created.
An “Unanswered” conversation is a conversation left without any reply from an operator. If an operator replies to a conversation and then stops sending any new messages in this conversation, the conversation won't be considered unanswered.
Let's see what “Team performance report” metrics conversations affect.
You can see the statistics on the whole team about a certain period of time or see the work of a particular operator. Since support is a team work, we would recommend beginning with general statistics and then moving to the individual stats.
We would also advise you to pay attention to the following metrics to analyze the work of your support team.
Open and closed conversations
The number of open conversations
On one hand, increasing the number of conversations is good for you: it means that you always get feedback from your users, leads are interested in communicating with you and ready to solve issues they experience instead of leaving you.
On the other hand, the increasing number of conversations means that leads are facing some issues. Listen to what they say, what they ask you about and what they complain about. You will make your future clients happier with such communications, as well as improve your support processes.
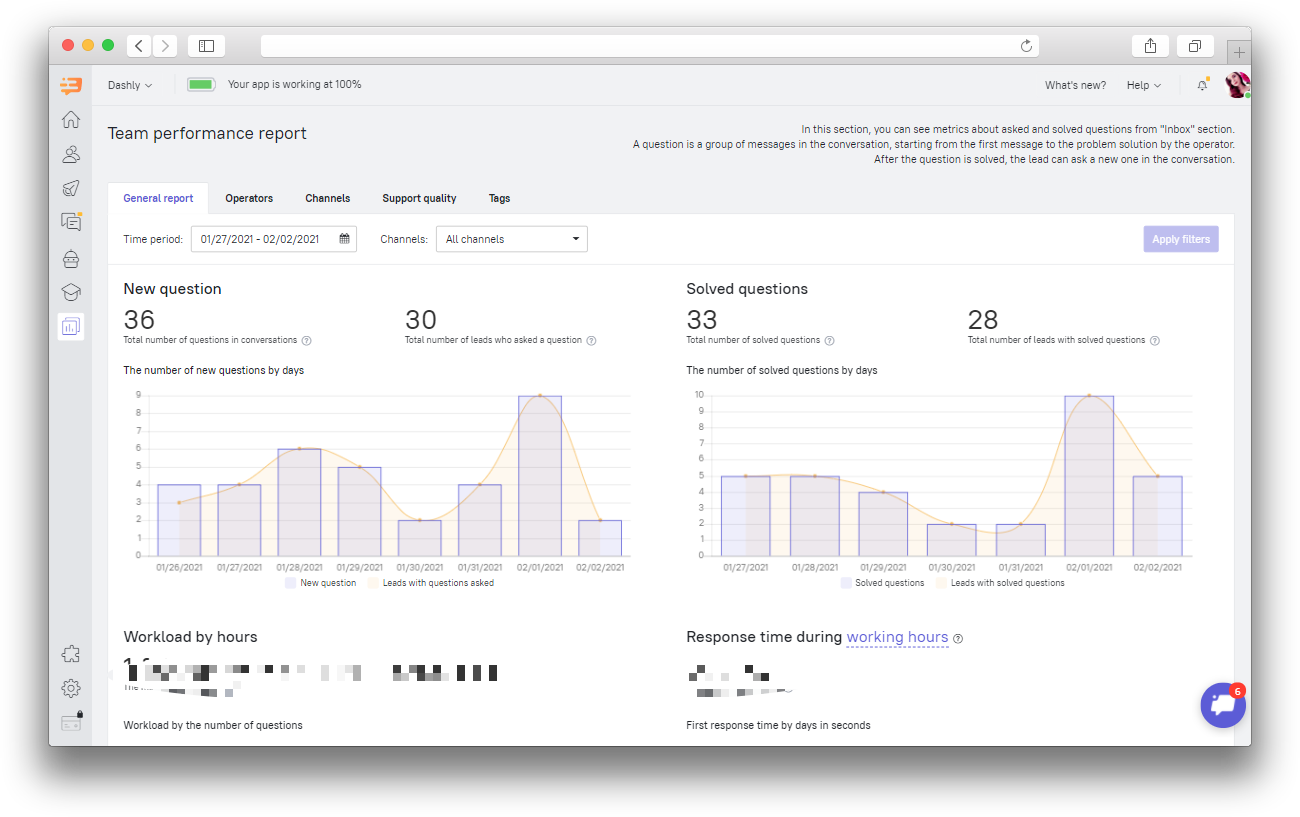
You can see the number of open conversations sorted by days in the “Team performance report”. It will help you find days with maximum and minimum workload to possibly change the shift pattern of your support team.
Number of leads who start conversations
The amount of conversations a user can start is unlimited, therefore the number of opened conversations will always be bigger than the number of leads that have started a conversation. Estimate the ratio. If you see there are 50 conversations but only 2 conversation starting leads, pay your attention to this. Check whether leads that talkative may be bots. See what questions they ask you. If someone contacts your support team just because they are bored, think about how to protect support service from such messages (hiding chat for this particular lead will help).
Number of closed conversations
This metric will show you how many conversations can be handled by your support team. This number should coincide with the number of open conversations. If the gap between these two numbers is big, you need to optimize the work of your team. Metrics given by Dashly will help you to find out the right way for optimization (see the info about this below).
You can also check the number of closed conversations sorted by days.
Number of leads with closed conversations
This number shows how many leads are now happy with issues you’ve solved for them. If the gap between this number and the number of conversations that have been opened, you should pay your attention to this. In addition to the options we’ve mentioned above, leads often initiate a lot of conversations when your operators close the ones that have been solved. However, those who ask a lot of questions may be considered the most loyal customers. Anyway, always check how the number of open and closed conversations is going.
Performance metrics
Workload by hours
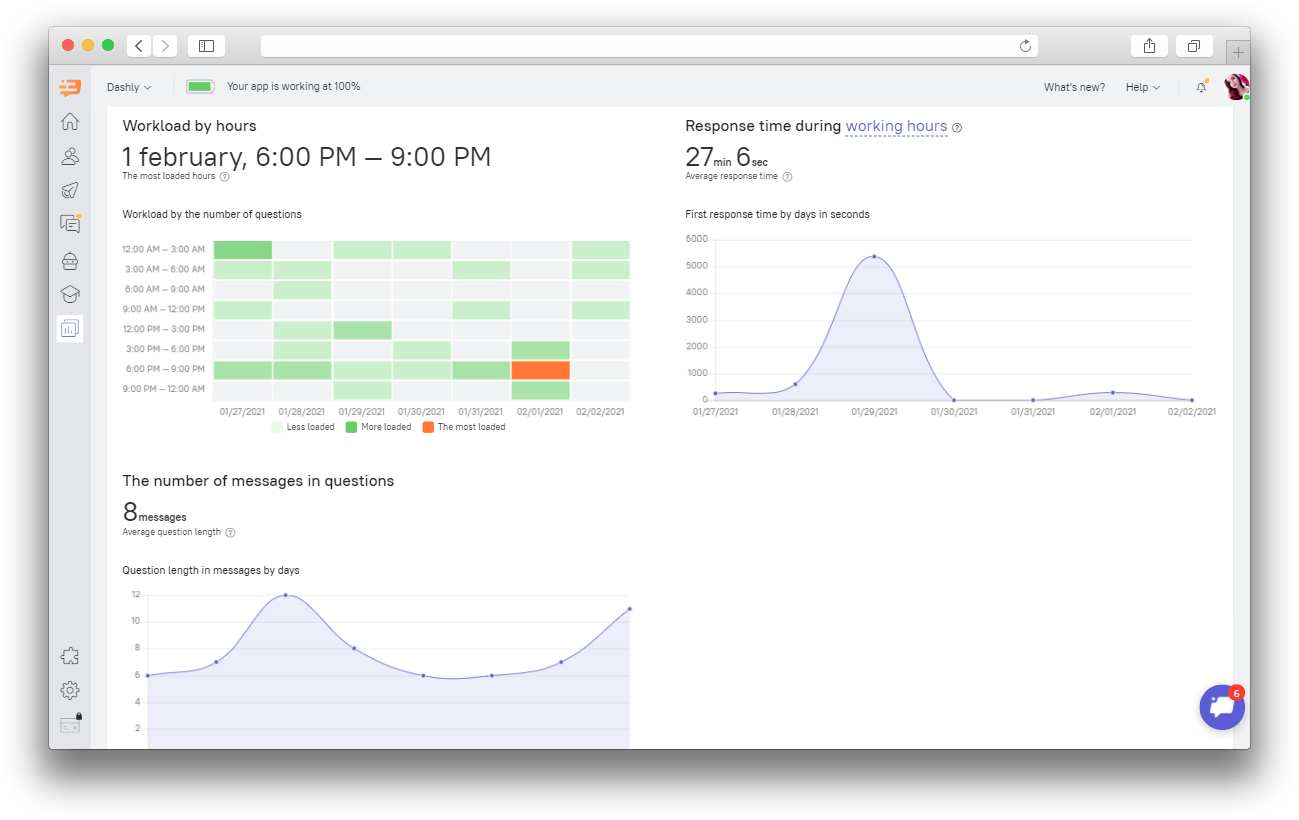 You can check the workload of your support team by hours. It will help you set the shift hours in the best way possible.
Response time
Nowadays, responses are not considered an advantage. These are a must. Leads get used to the high speed of communication, so they are not ready to wait for too long.
Do not rush your support team to close all conversations within 12 hours. Remember that the balance between response rate and support service is very fragile.
The number of messages in questions
Try to solve questions with as little messages as possible.
Operator's individual metrics
It's hard to find out what to improve without any metrics. You can intuitively guess who the best support agent is. Have you ever wondered what makes them successful?
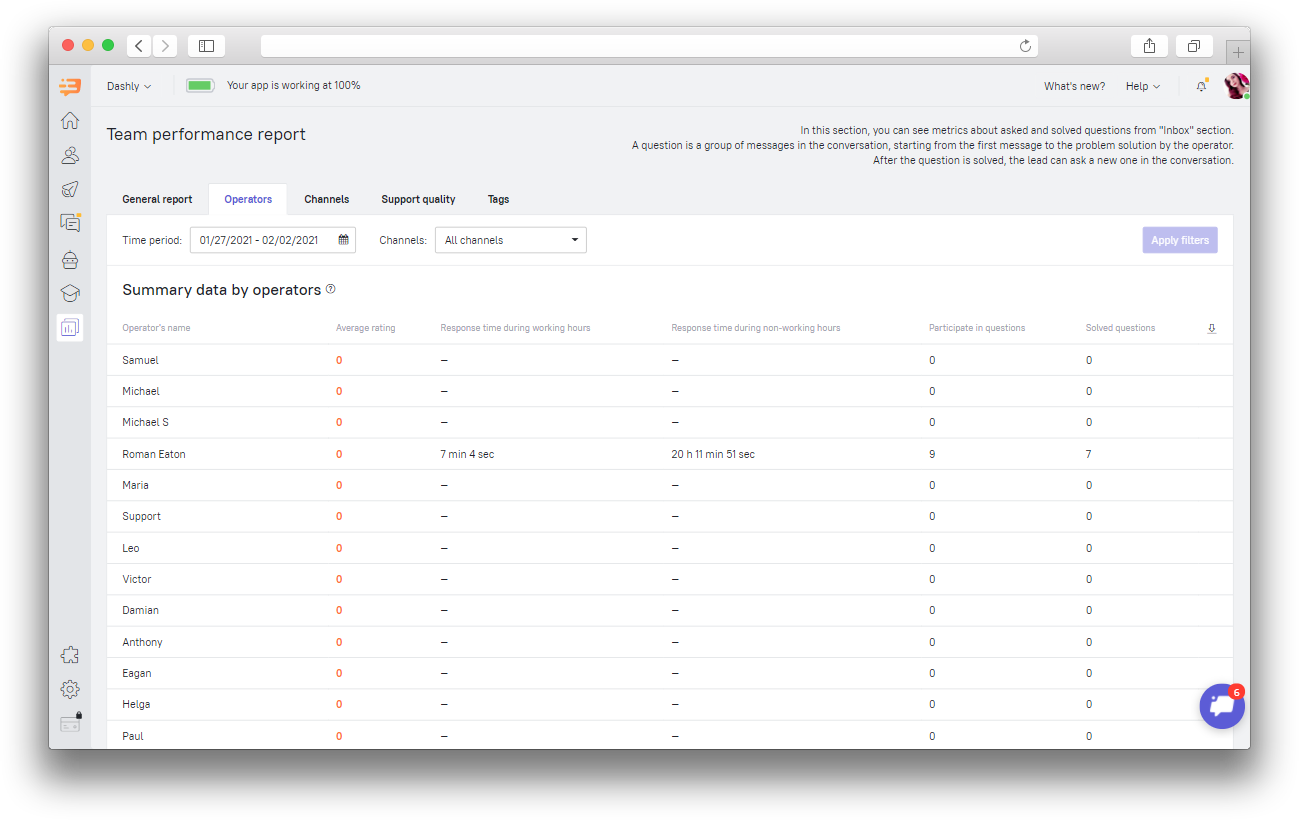
Average rating shows how much users appreciate the assistance of a chat operator they’ve had conversations with.
The response time shows how much effort each operator puts into answering conversations created by your users.
The number of conversations an operator participated in and how many conversations were closed will tell you about the work done by the operator. Pay your attention to whether they cope with the amount of conversations assigned to them.
Number-based analysis is always important. With conversation statistics you can analyze the performance of your support service and each operator individually. This can improve the work of your whole support division and make your leads even happier, which they will thank you for with higher LTV.
Channel metrics
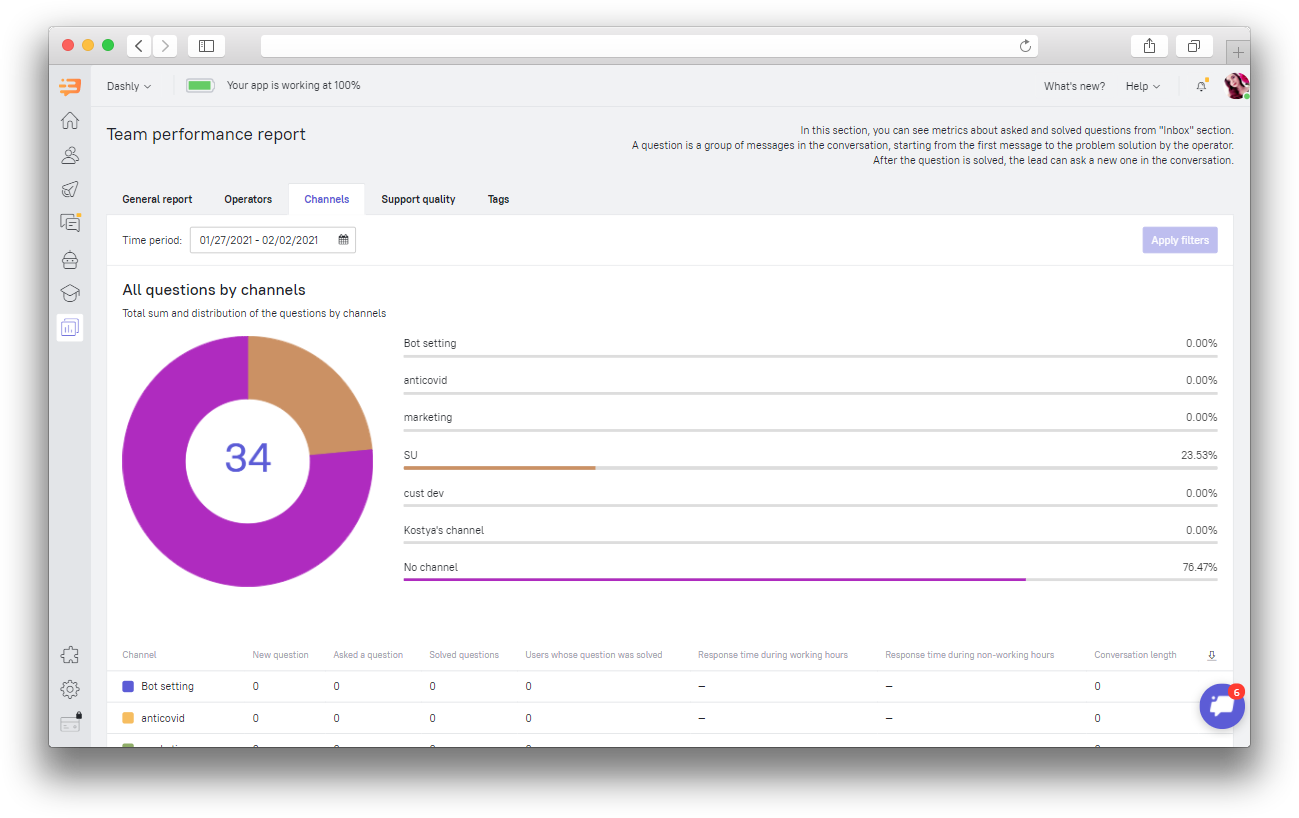
This metric shows statistics on the amount of conversations in different channels. It accumulates the metrics from the “General report” and “Operators” tabs on the channel scale.
Support quality metrics
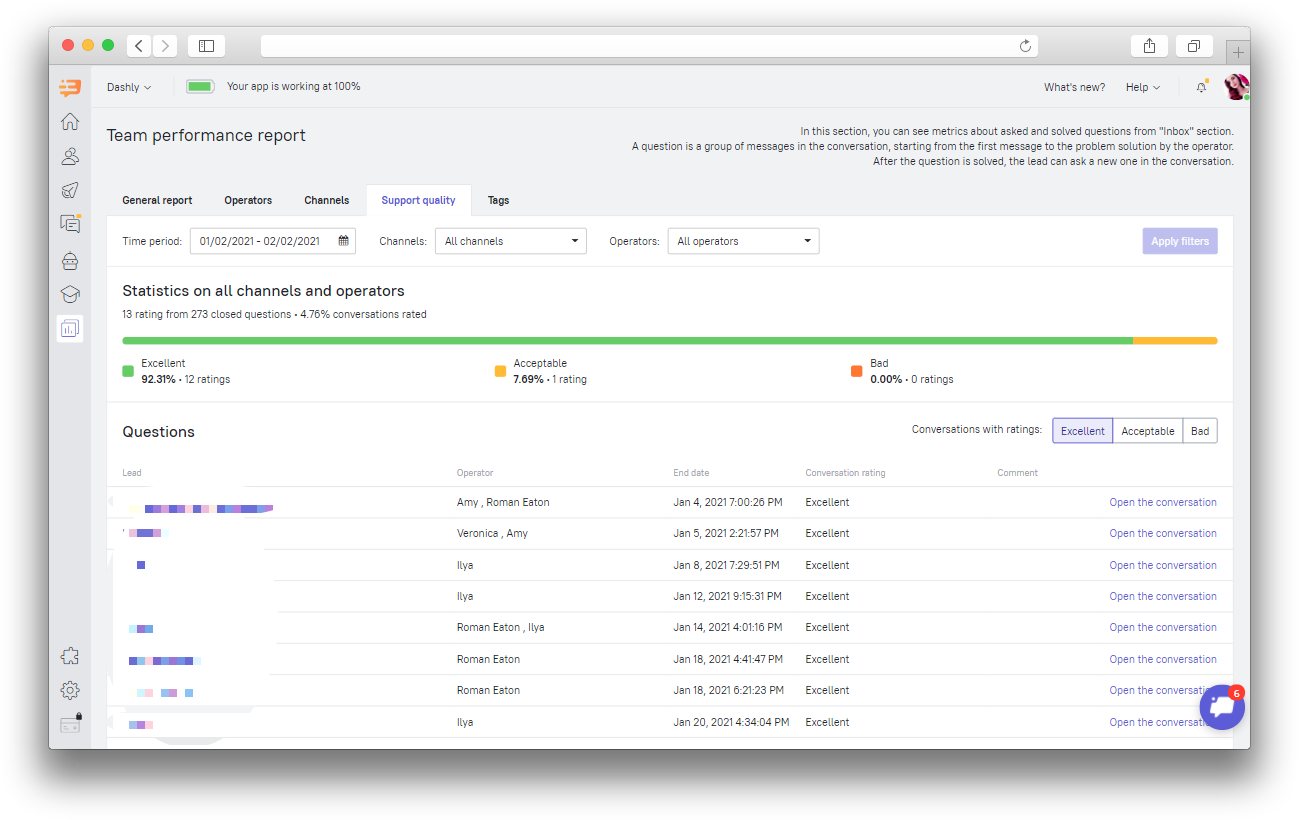
This tab shows how users rated conversations you’ve had with them and which conversations these exactly were. By taking a closer look at the conversations your users rated, you can learn what your operators have done right and what they have done wrong so you can stick to the things done right and work your way around the things that have gone not so well in the future.
Tag metrics
Usually chat operators assign conversation tags to seek out the common conversational patterns, which is important in understanding what concerns your customers and what they miss. Tag metrics will give you and your team the information important for decision making.
For example, with tag metrics you will be able to do the following:
Add the answers to the most frequently asked questions your users ask you into your knowledge base or as saved replies for your chat operators
Boost your marketing content with the data based on the reviews and inquiries from your users
Improve the onboarding process for your customers, in case the one you have now is not clear enough
Gather and classify information on frequent bugs for your dev team to fix those
Understand what functions have to be added to your product or tweaked
Know what products you sell are popular and what items your catalog lacks
You can find the tag metrics in the “Tags” tab:
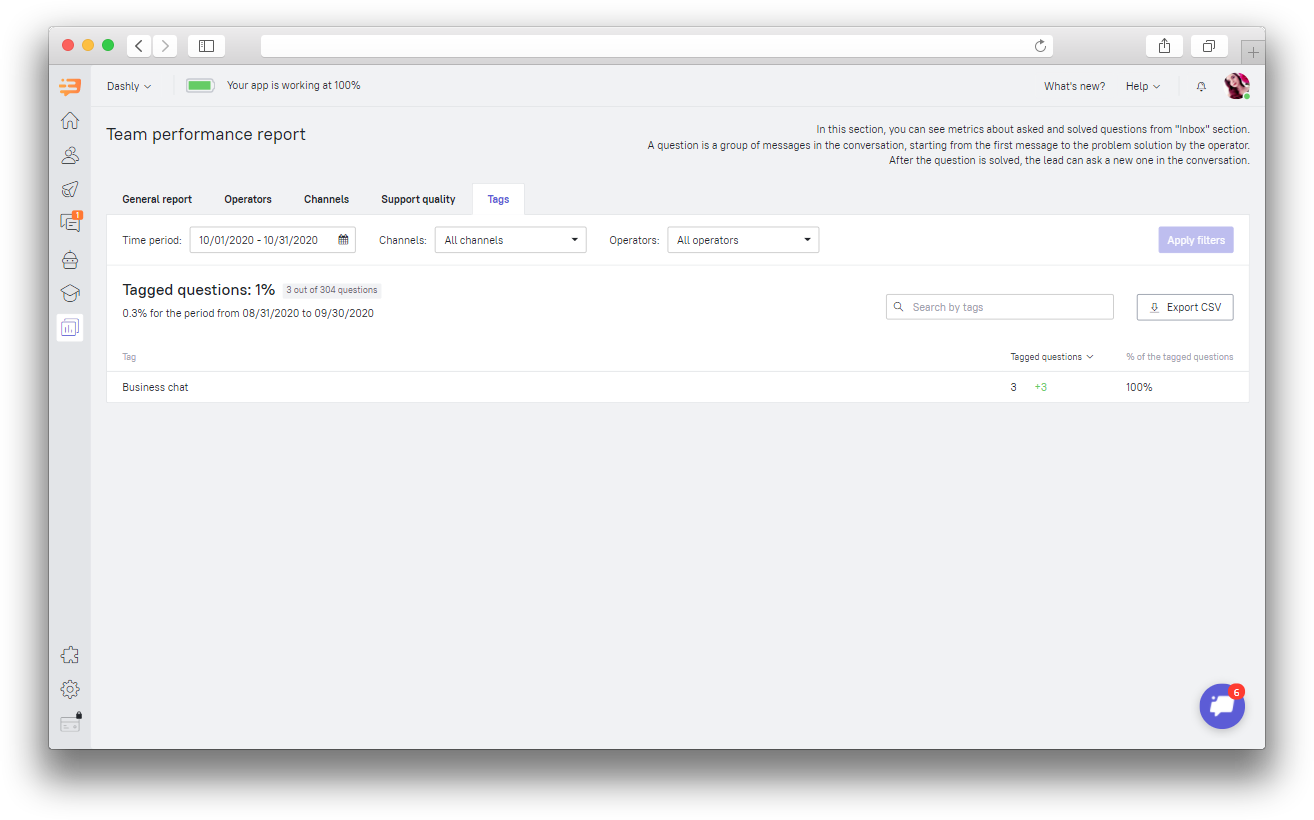
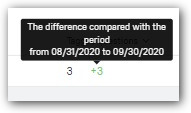
The tab shows the number of tagged questions and its percentage in relation to the general number of questions. Use this to understand the percentage of questions about billing, technical issues and so on.
The difference compared with the previous period appears next to the amount of questions with this tag: