
In-app triggered message statistics
Once you set up a triggered message for a mobile application, you can check its statistics in the "Triggered messages" section.
You can see detailed report for every message:
How many times it was sent;
How many times it was read;
How many times users replied to it;
How many times users clicked on a link in it.
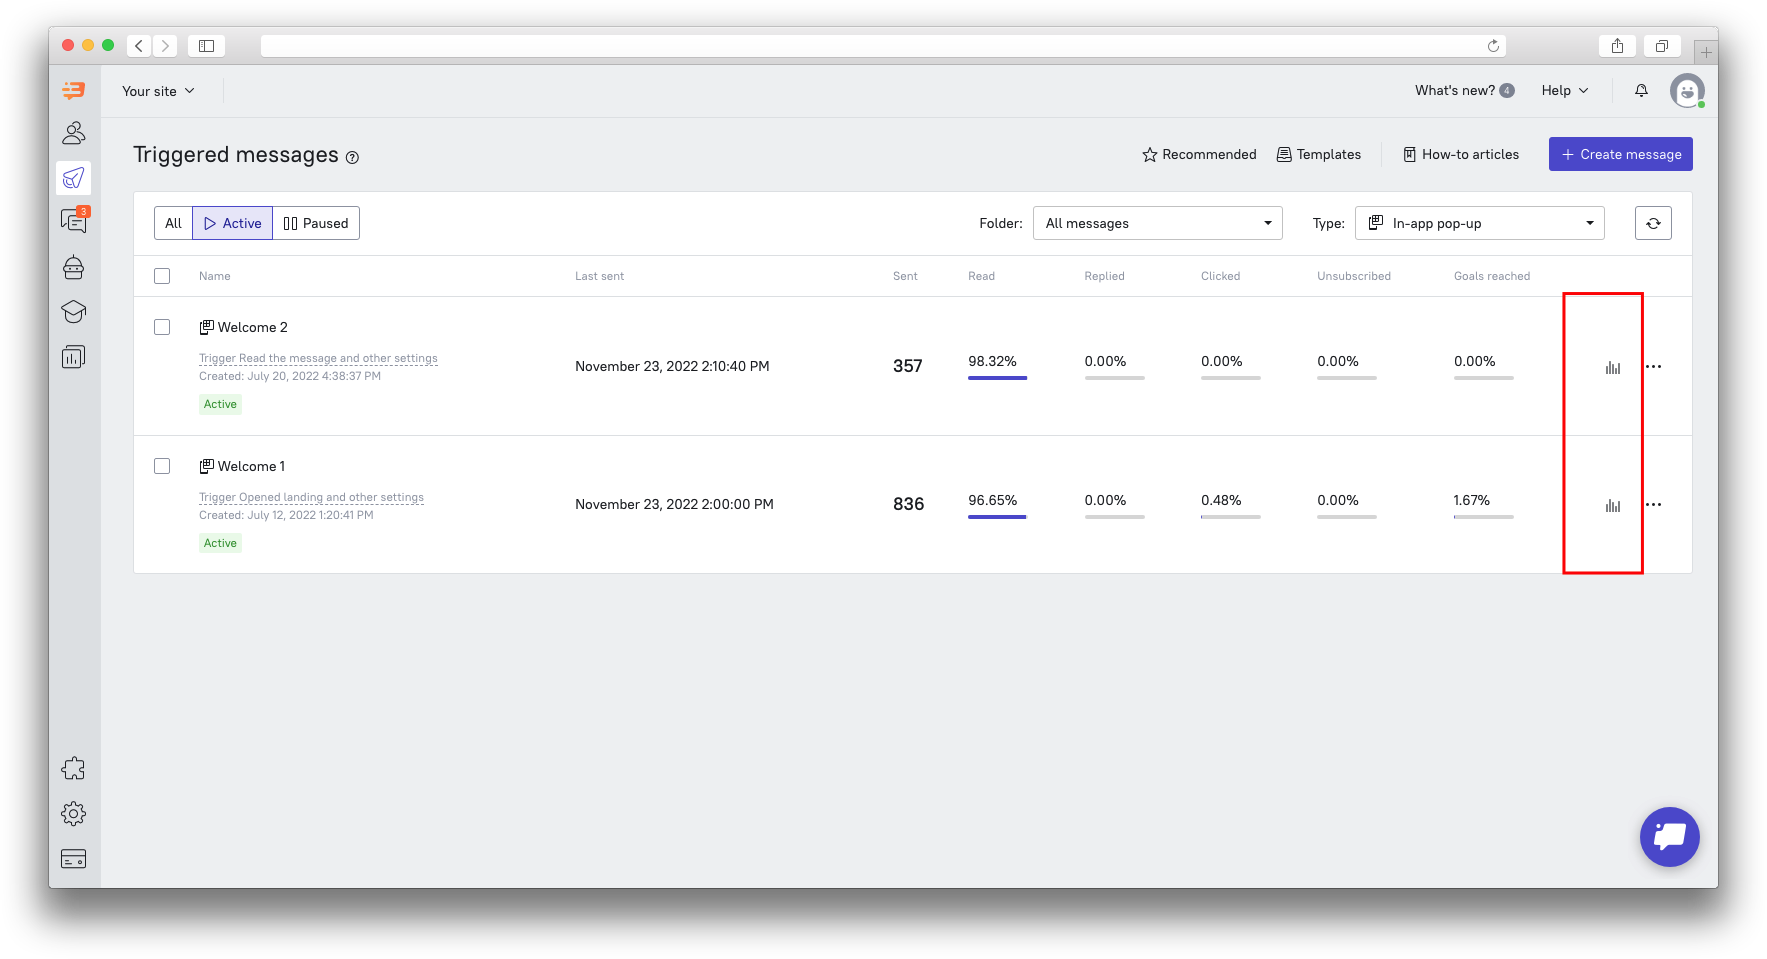 To check detailed statistics click the "Report" button next to a triggered message.
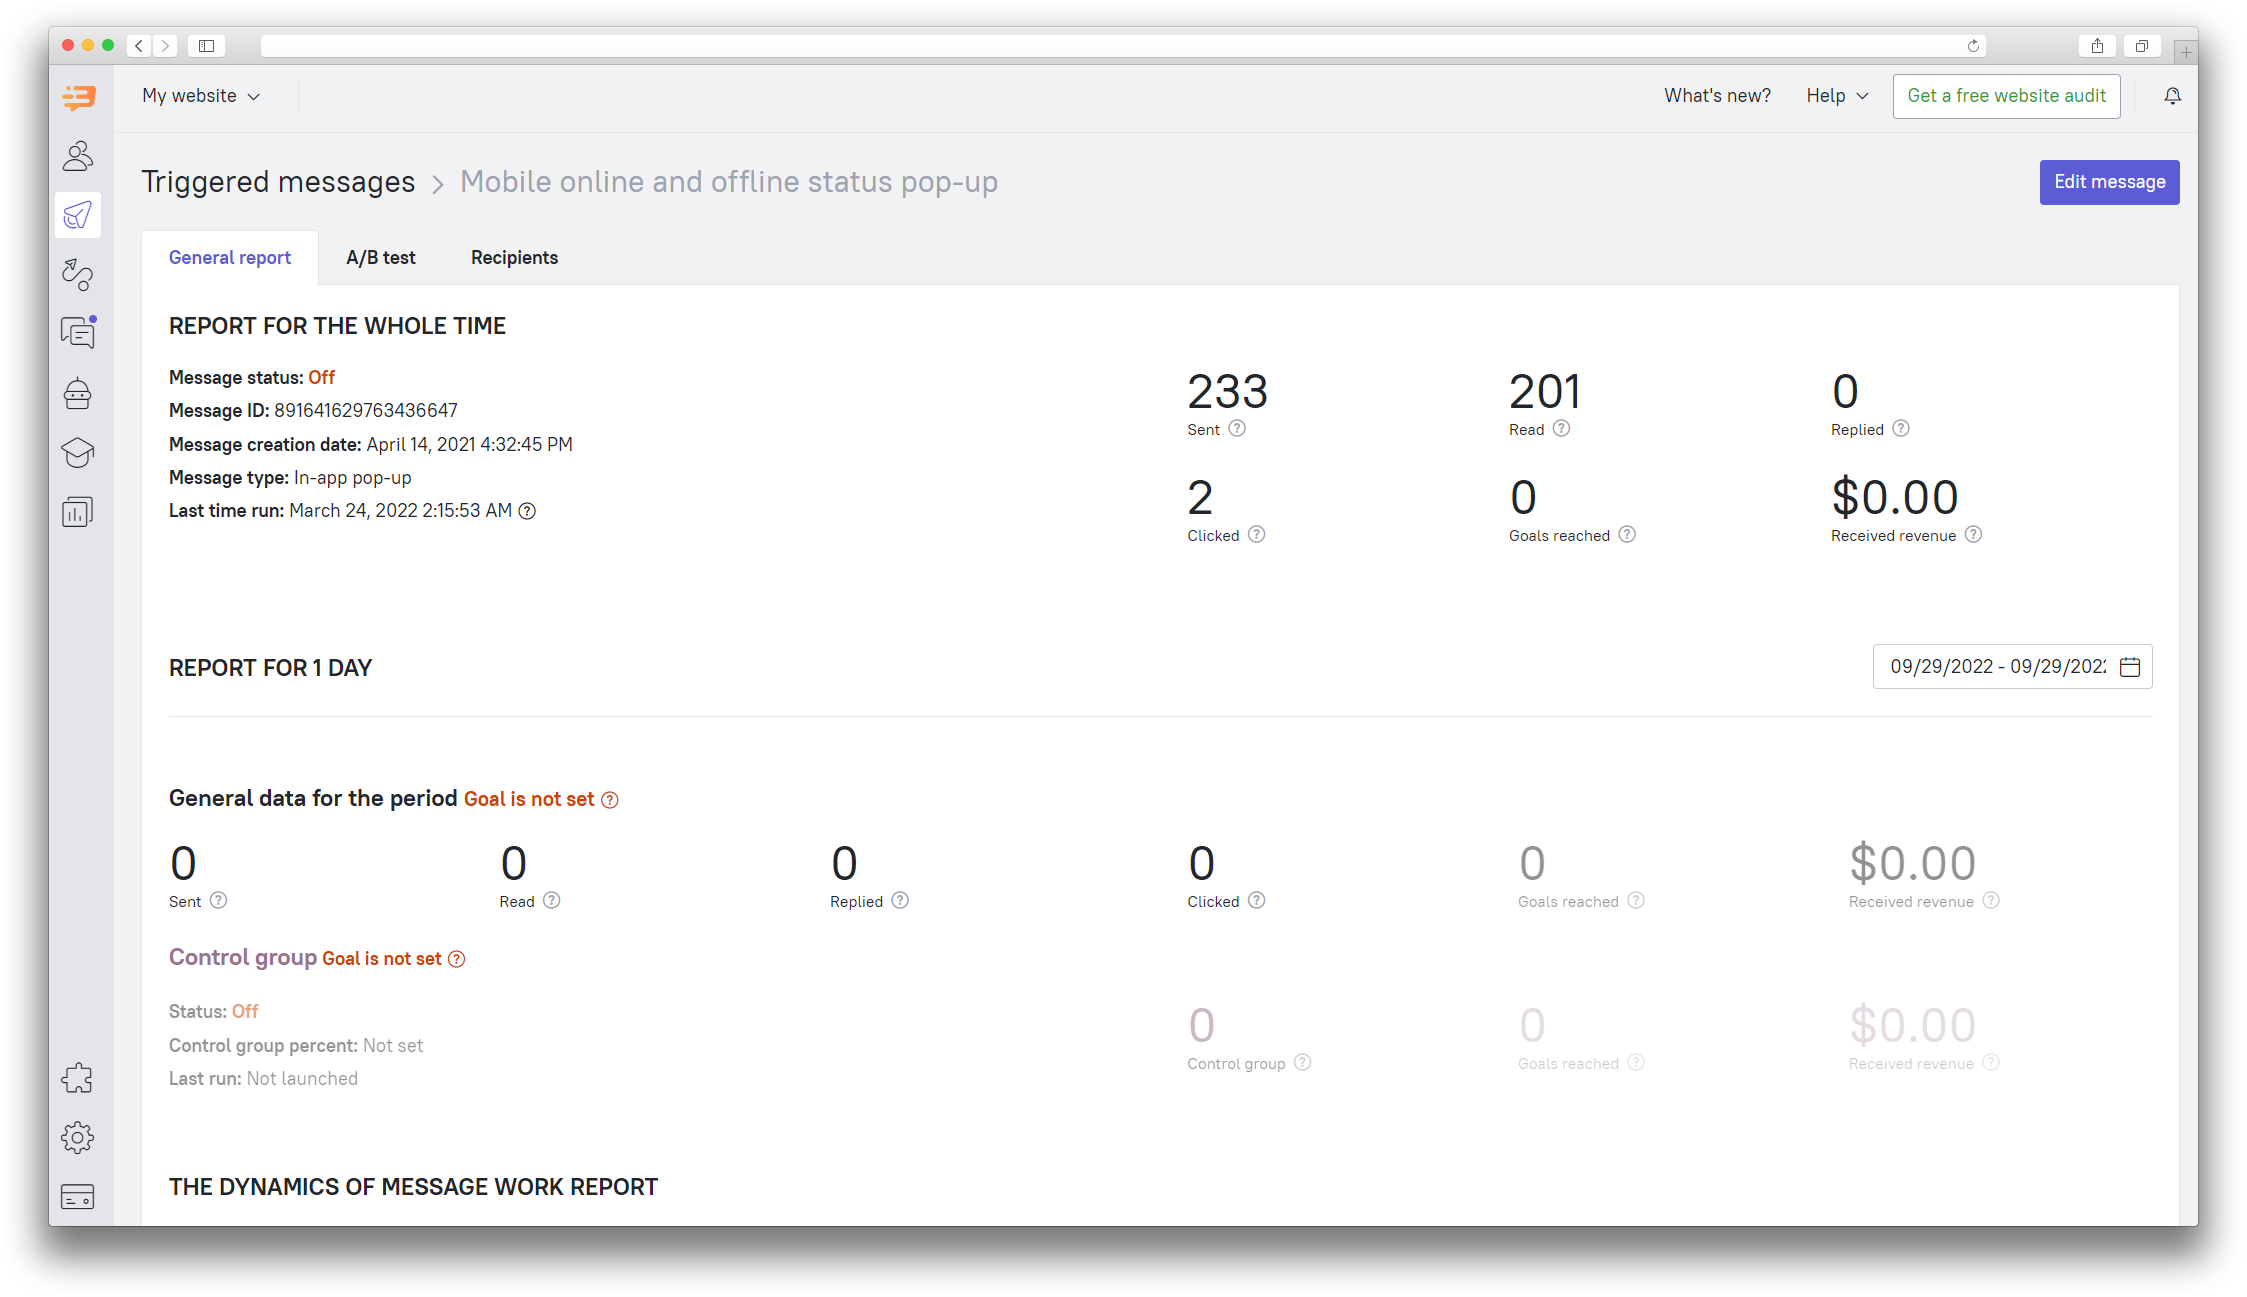
You'll see the detailed information about this message:
Message ID. It is used to identify messages with different requests;
Message type. There are 3 types of messages for the app: in-app chat message, in-app pop-up, in-app push.
Message creation date;
Last time sent;
The number of sent messages;
The number of read messages and the percentage compared to the number of sent messages;
The number of replies to the message and the percentage compared to the number of sent messages;
The number of leads who clicked on the link and the percentage compared to the number of sent messages.
The A/B test tab will show statistics for both A/B versions of your triggered message so you can set the most profitable ways to communicate with visitors. You can read about how to configure the A/B tests in this article.
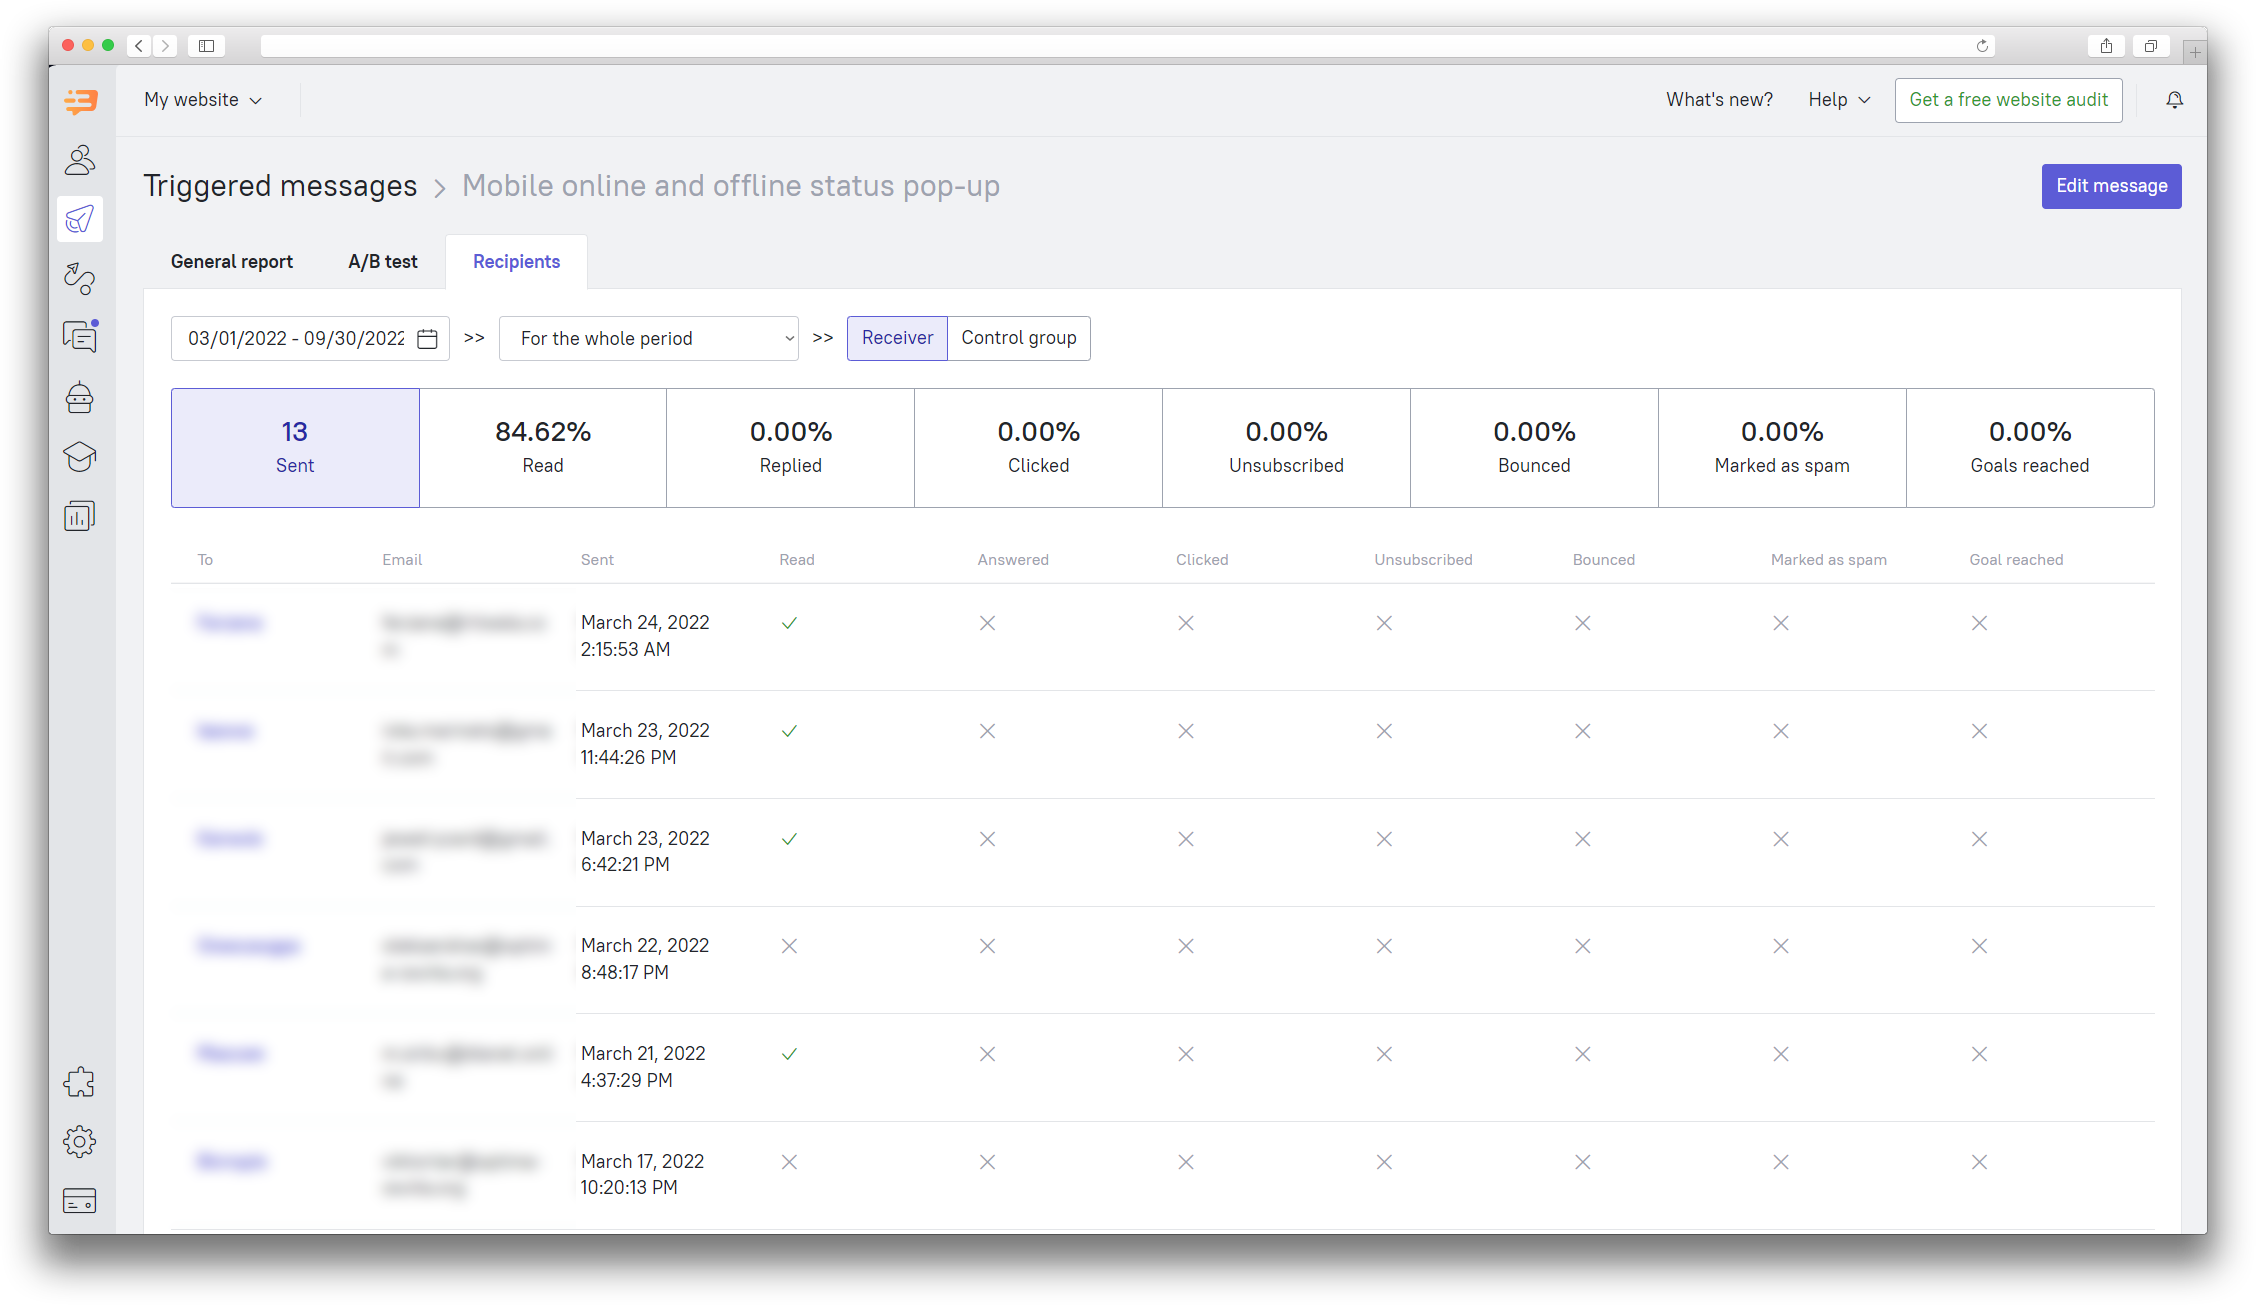
The “Recipients” tab will show all leads the message was sent to and how they interacted with the message.
Please note that only users who have a Firebase token can receive a "Push" message. The message won't be sent to the users without the token.
The "Read the message" event for the in-app push means that the message has been received by the user's device. If a link was added to the push, then the statistics will also show clicks on the link.